Overview "My Report"
In the sidebar, click "My Report" to start entry in the web app. The default view is the weekly view.
Violations of rules such as minimum breaks or maximum working times are shown collected at week closure and have to be confirmed there. Which rules apply and what warnings and errors mean is described under Rule checks in the GAV compliance chapter.
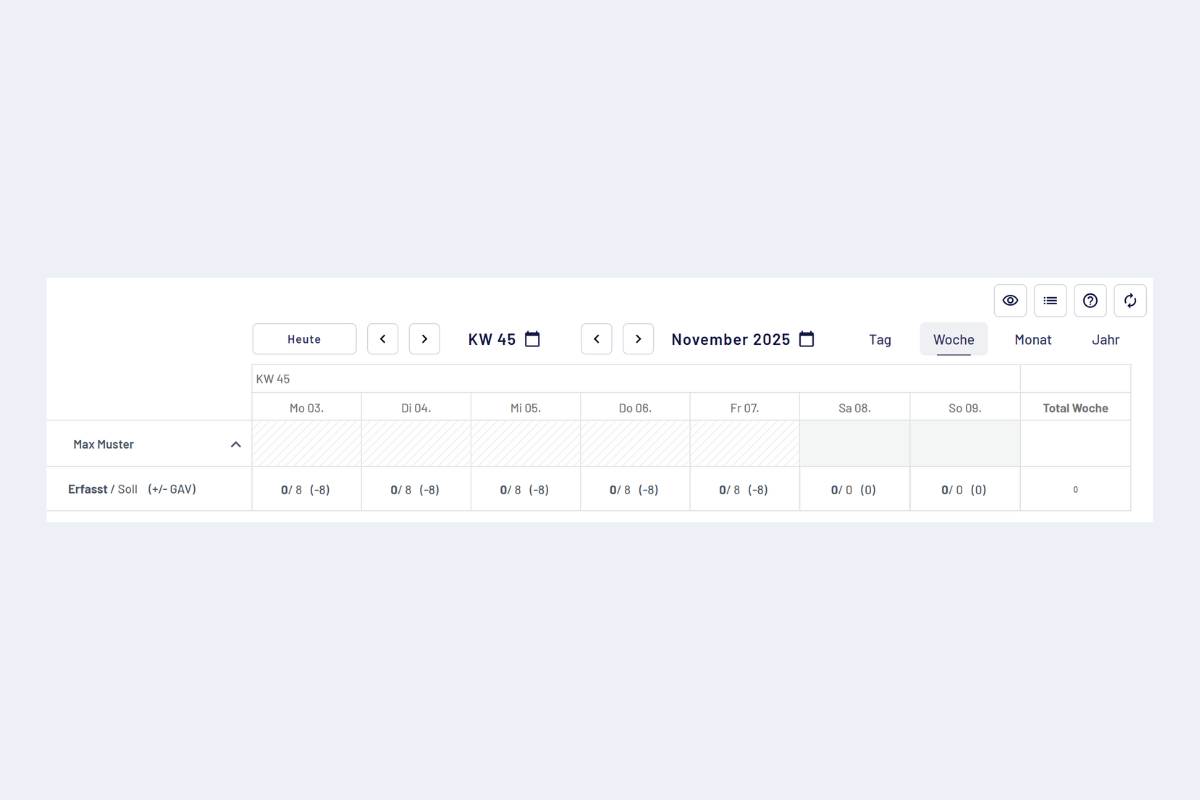
Report entry, weekly view
Views
Four views depending on the scope of entry:
- Daily view
- Weekly view
- Monthly view
- Yearly view
Navigating the timeline
- Arrows left/right or date picker: jump to the desired time period.
- "Today": back to the current date.
- Click on calendar week or month: pop-up for quick selection.
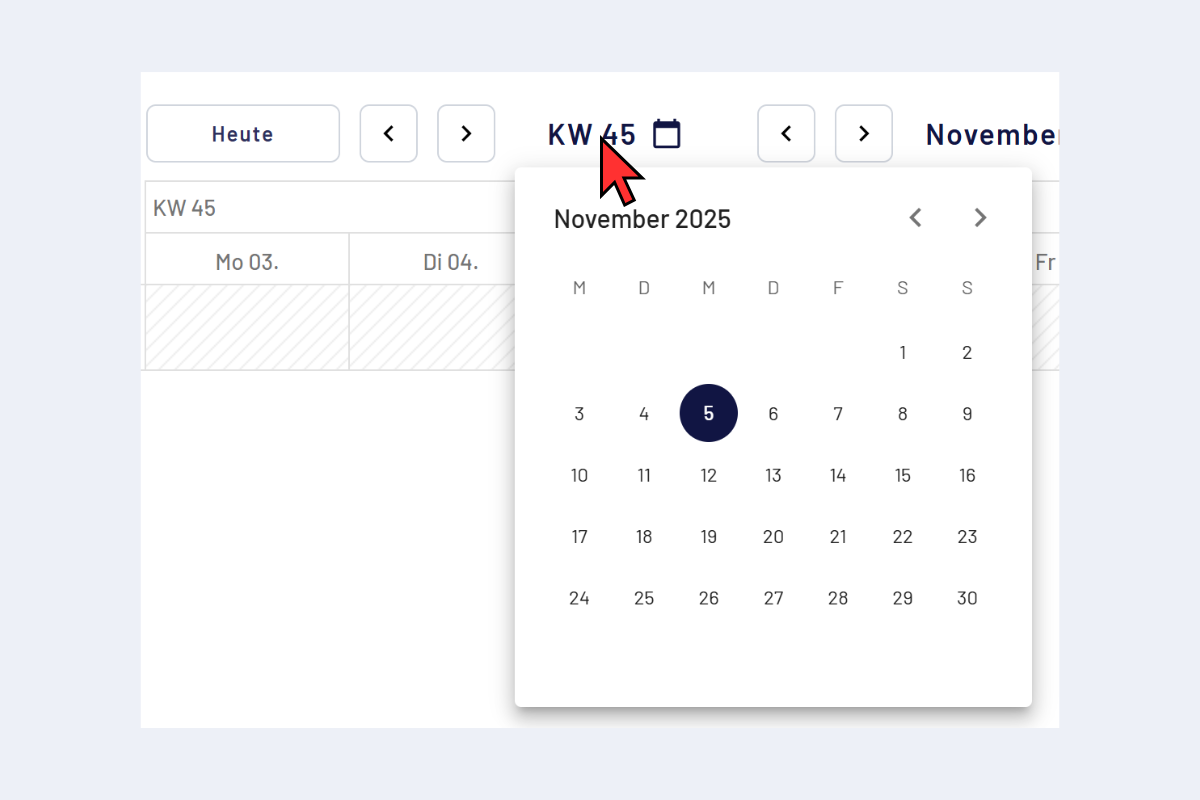
Timeline, selection by calendar week
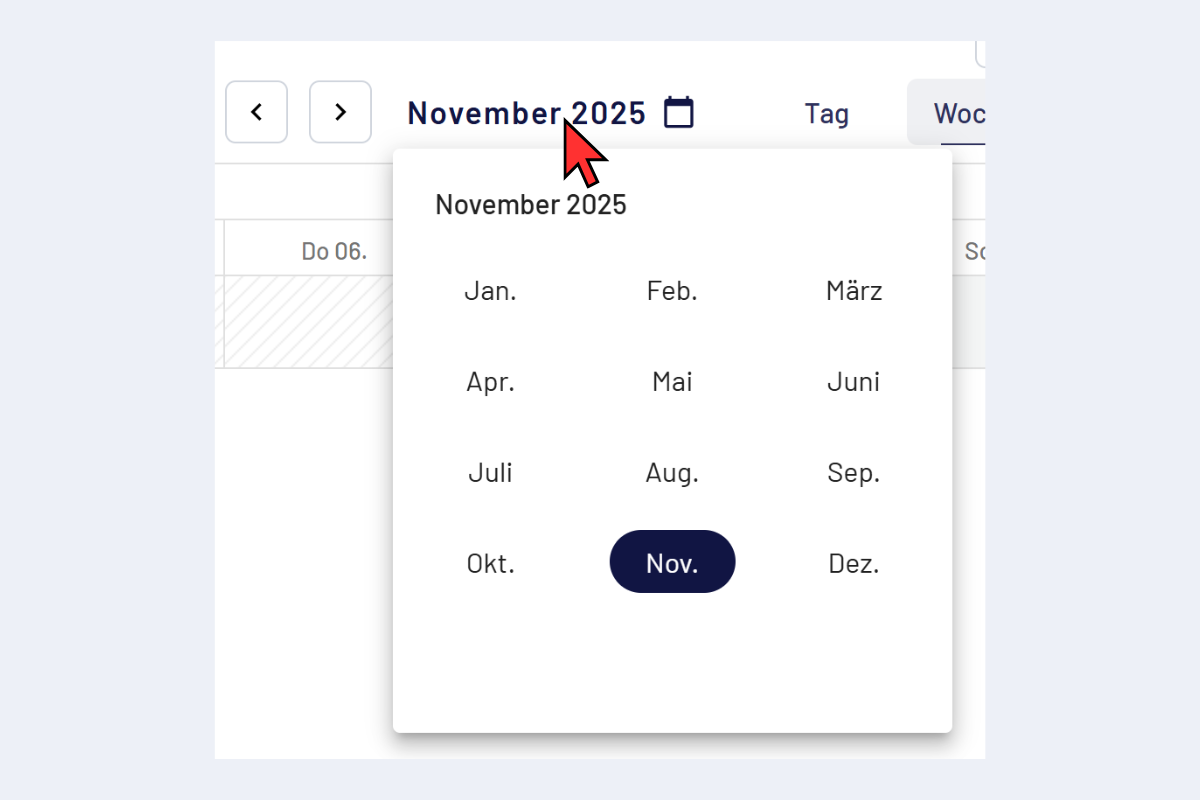
Timeline, selection by month
Display options
The display options control which information is shown per report block. The following fields can be turned on or off individually:
- Name: title of the entry (project, absence type, etc.).
- Approval status: current state in the approval process.
- Hours: number of hours recorded per block.
- Attachments: indicator of stored attachments such as medical certificates or receipts.
- Additions: additions and supplements added.
This way, the overview can be made as detailed or as reduced as suits your own working style.
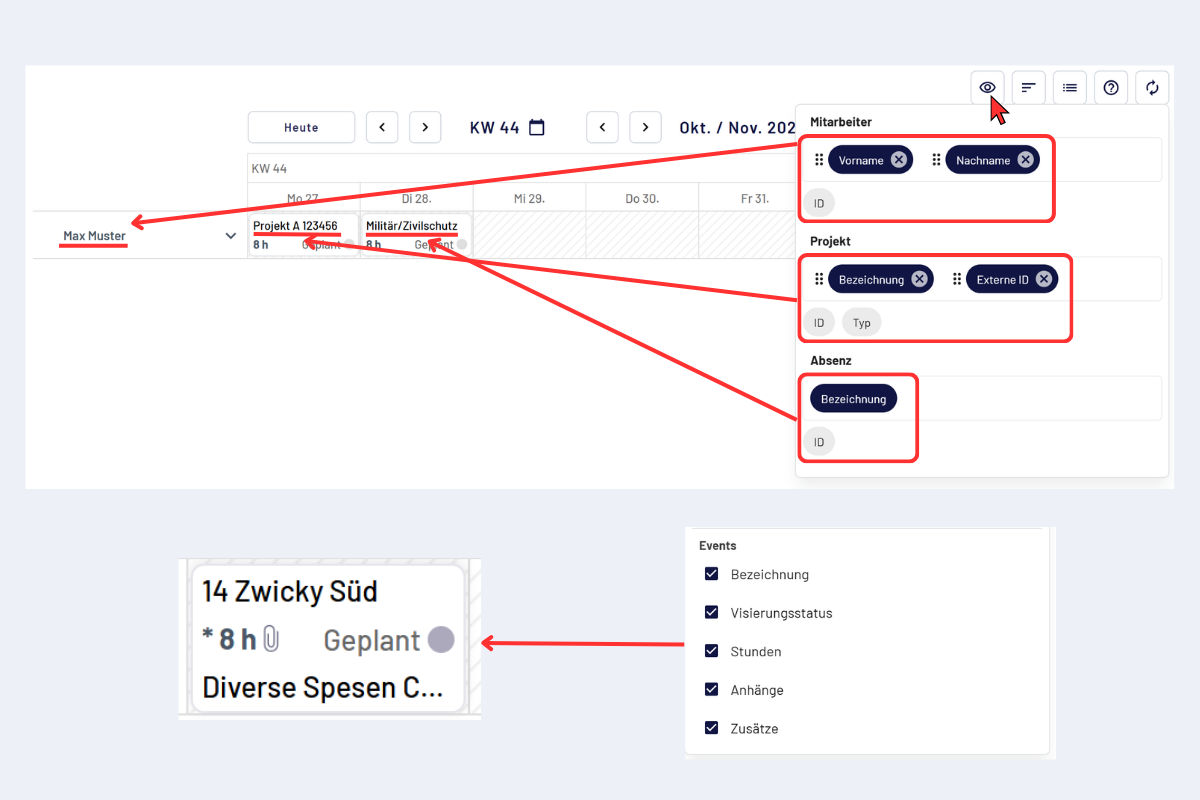
Display options
To the right, "Sort employees" also appears. In "My Report", this option is not relevant; it only applies in "My Employees" when several people are listed.
Audit log
The audit log documents every action seamlessly with timestamp and comment. Clicking the icon opens the log entries for the current view (e.g. week). The log is visible to all involved parties, for example to see the reason for a rejection.
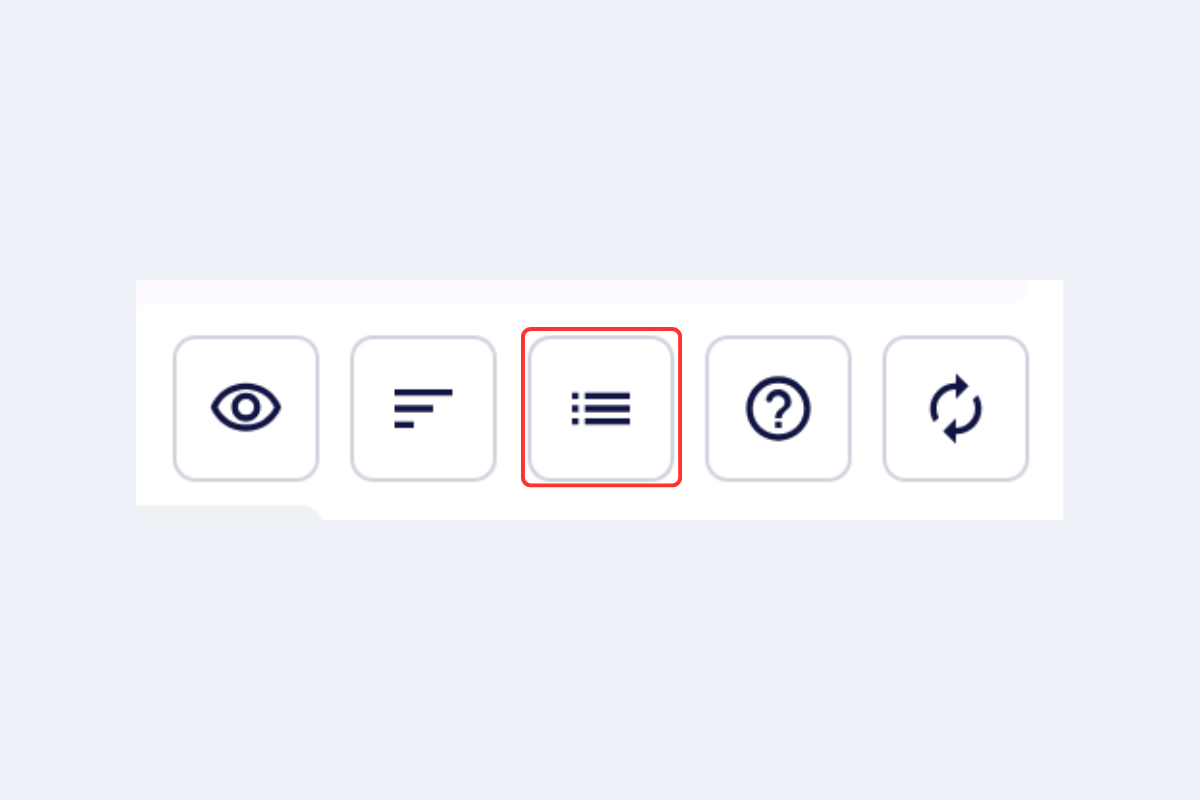
Audit log, icon
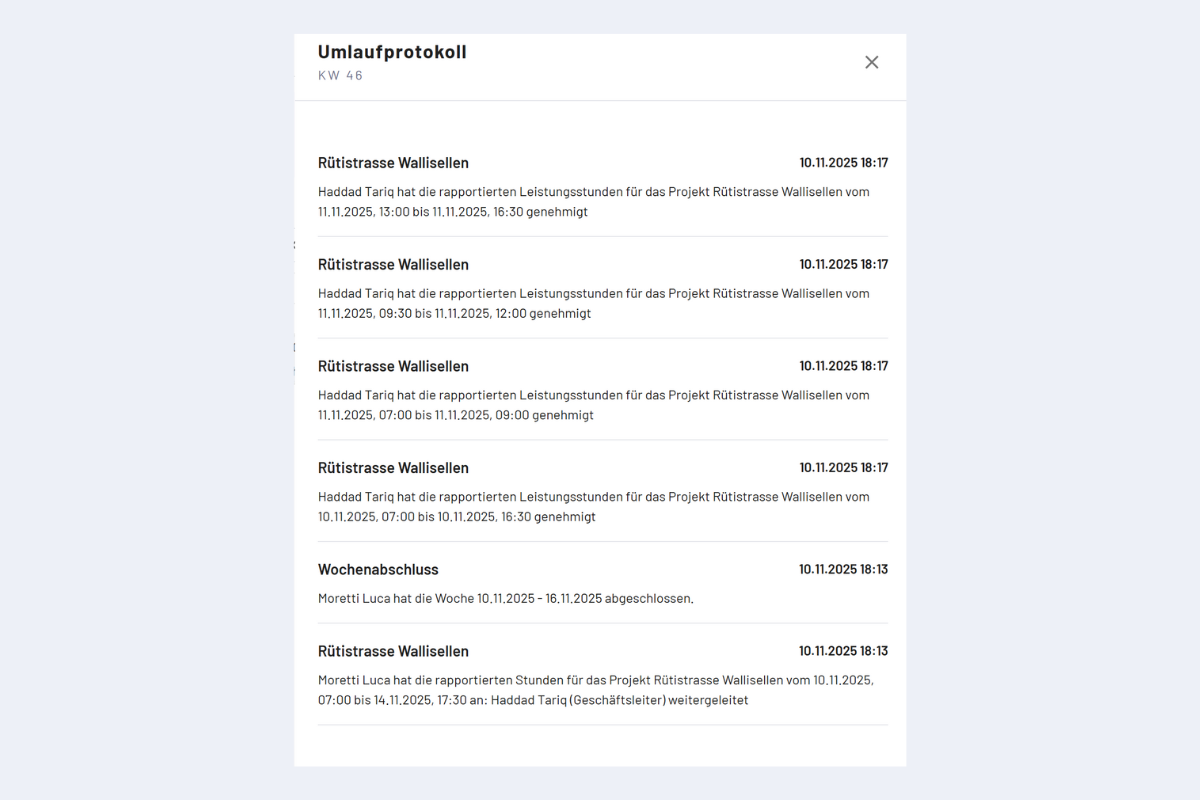
Audit log, example view
Legend
The question mark icon to the right of the audit log opens the legend with the colors and their meaning.
Each stage of the approval structure has its own color coding. As soon as a report enters the approval flow, it takes on the color of the stage it currently sits at. This way, you can see at a glance where a report is in the approval process and look up the color in the legend to identify the corresponding stage.
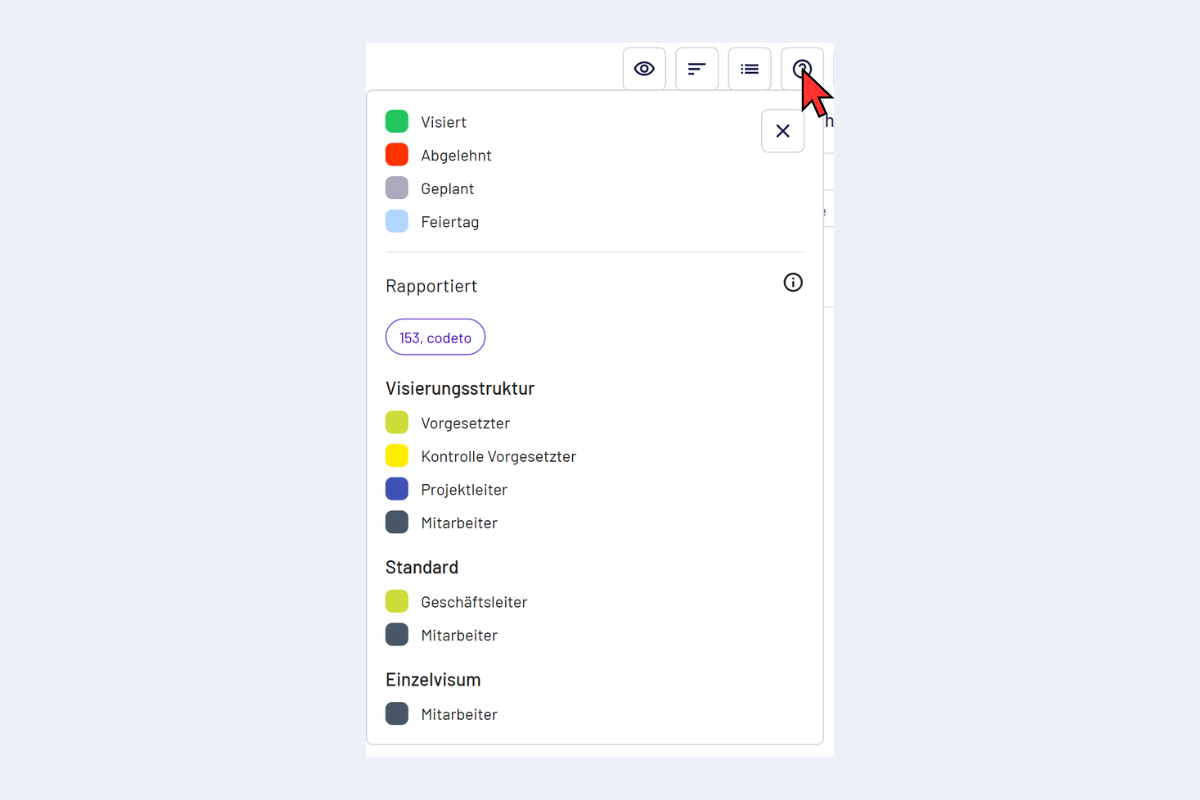
Legend with color coding per approval stage
Detail view (expanded)
The detail view shows the actual and target hours per day as well as the difference in parentheses.
Example week with target 40 h, still empty. For Monday, 3 November:
- 0 = hours reported so far (actual)
- 8 = target time
- (−8) = difference from target time
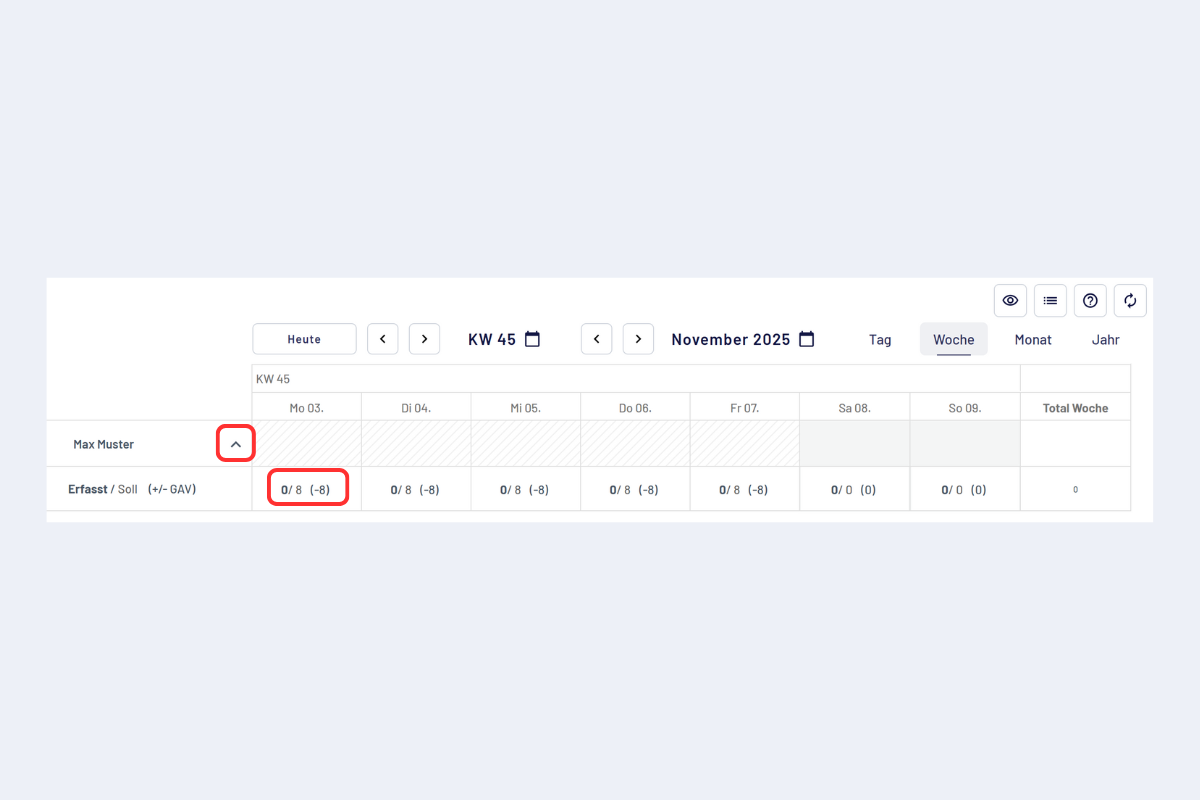
Weekly view, expanded
Create report (drag and drop)
Hold the mouse button and drag across one or more days, then release. A pop-up opens for the details.
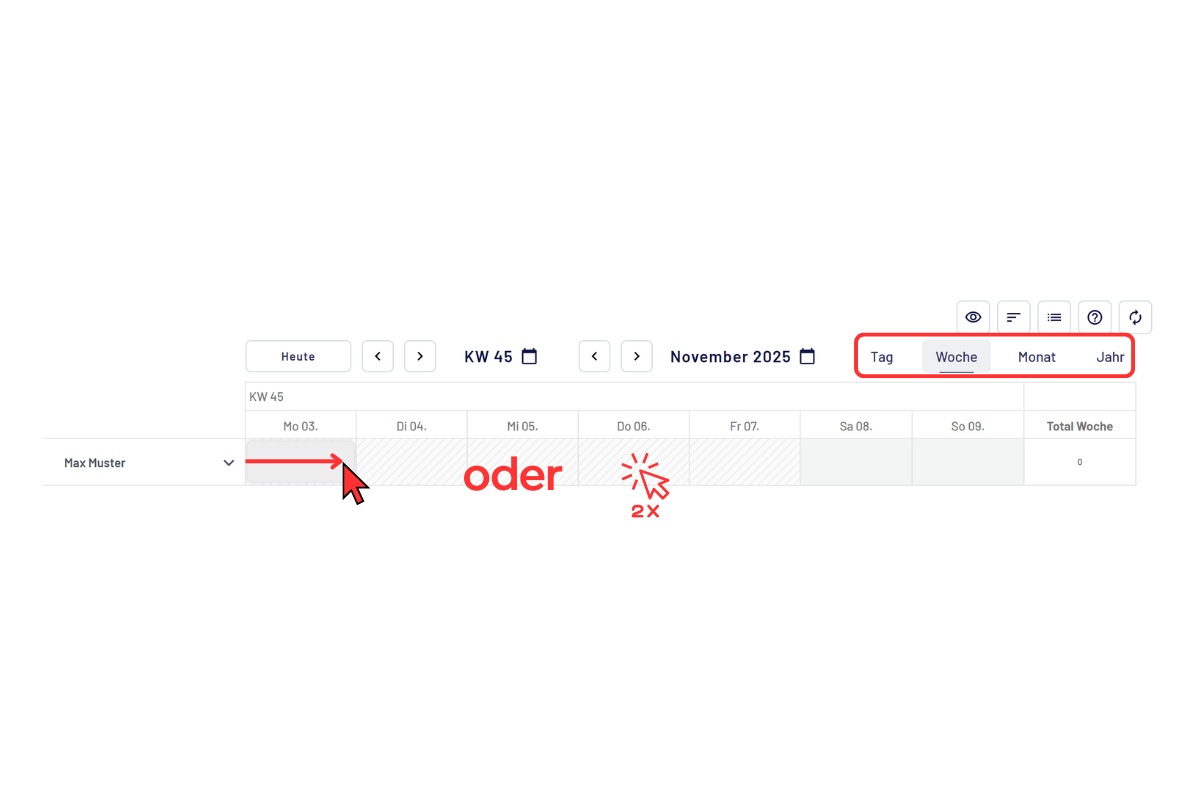
Create report, drag and drop
Then choose the type of entry: